Signal Analysis
Create signals for analysis
np.random.seed(0)
# sampling parameters
fs = 100   # sampling rate, in Hz
T = 1      # duration, in seconds
N = T * fs  # duration, in samples

# time variable
t = np.linspace(0, T, N)

SNR = 0.2 #noise

XX0 = np.sin(2 * np.pi * t * 7+np.pi/2) #+ np.random.randn(1, N) * SNR
XX1 = signal.sawtooth(2 * np.pi * t * 5+np.pi/2) #+ np.random.randn(1, N) * SNR
s1, s2 = XX0, XX1
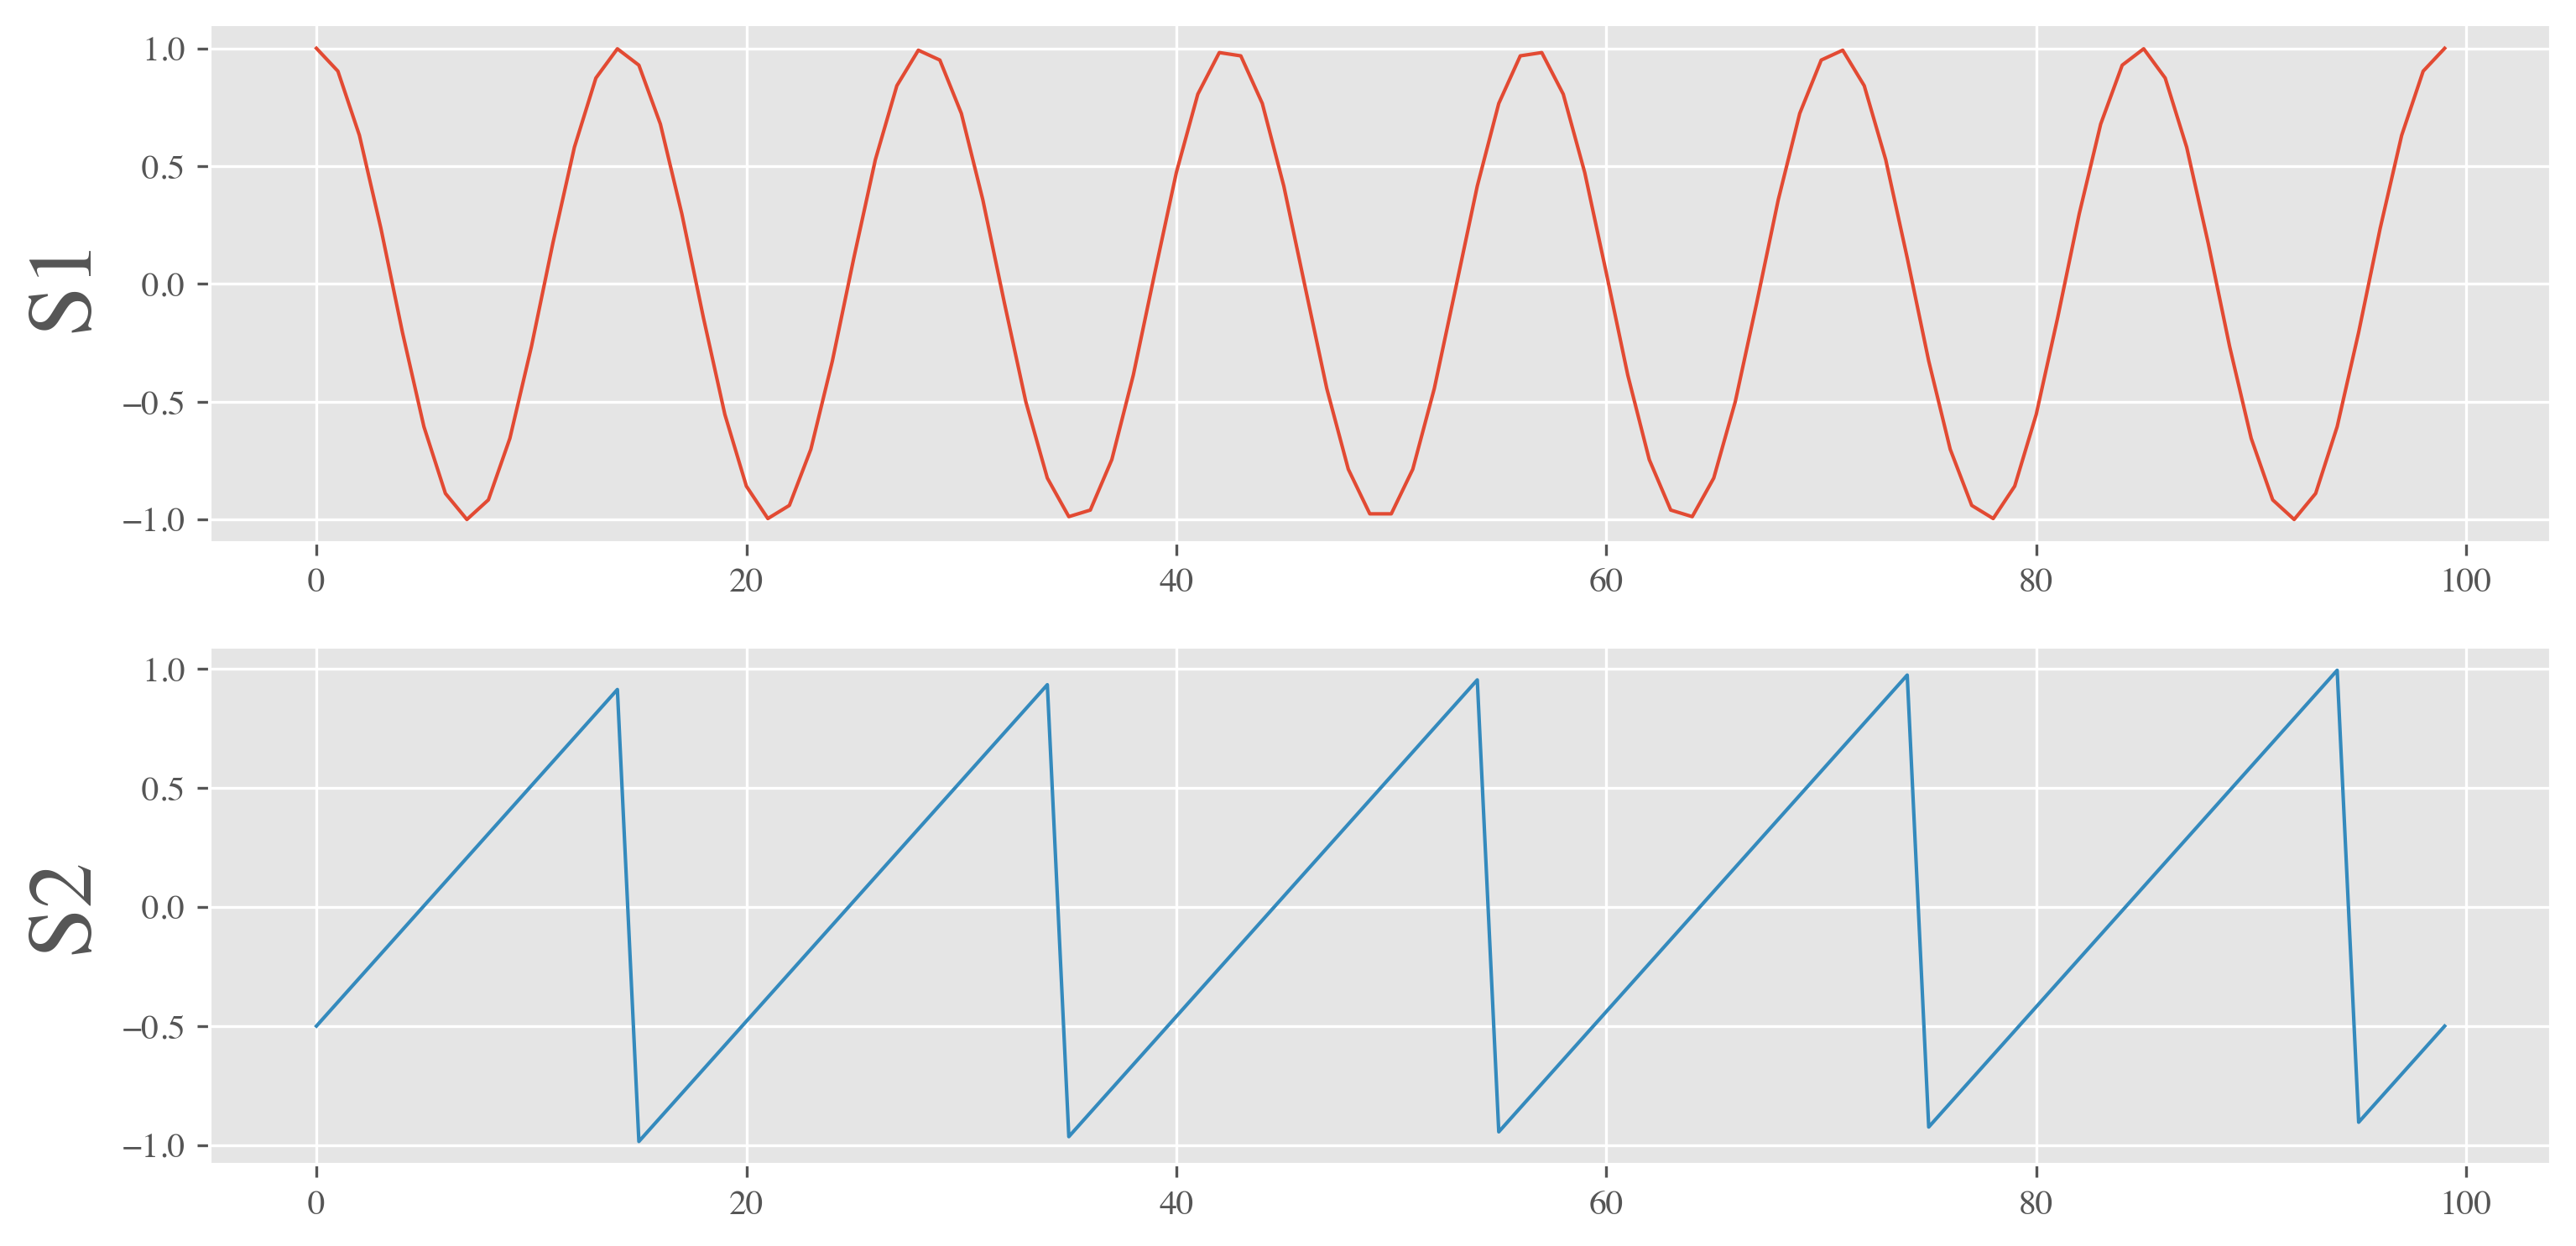
Inspect the DTW distance between two signals
dtwsig = dtw_signal_pairs(s1, s2, labels=['S1', 'S2'])
dtwsig.plot_signals()
plt.show()
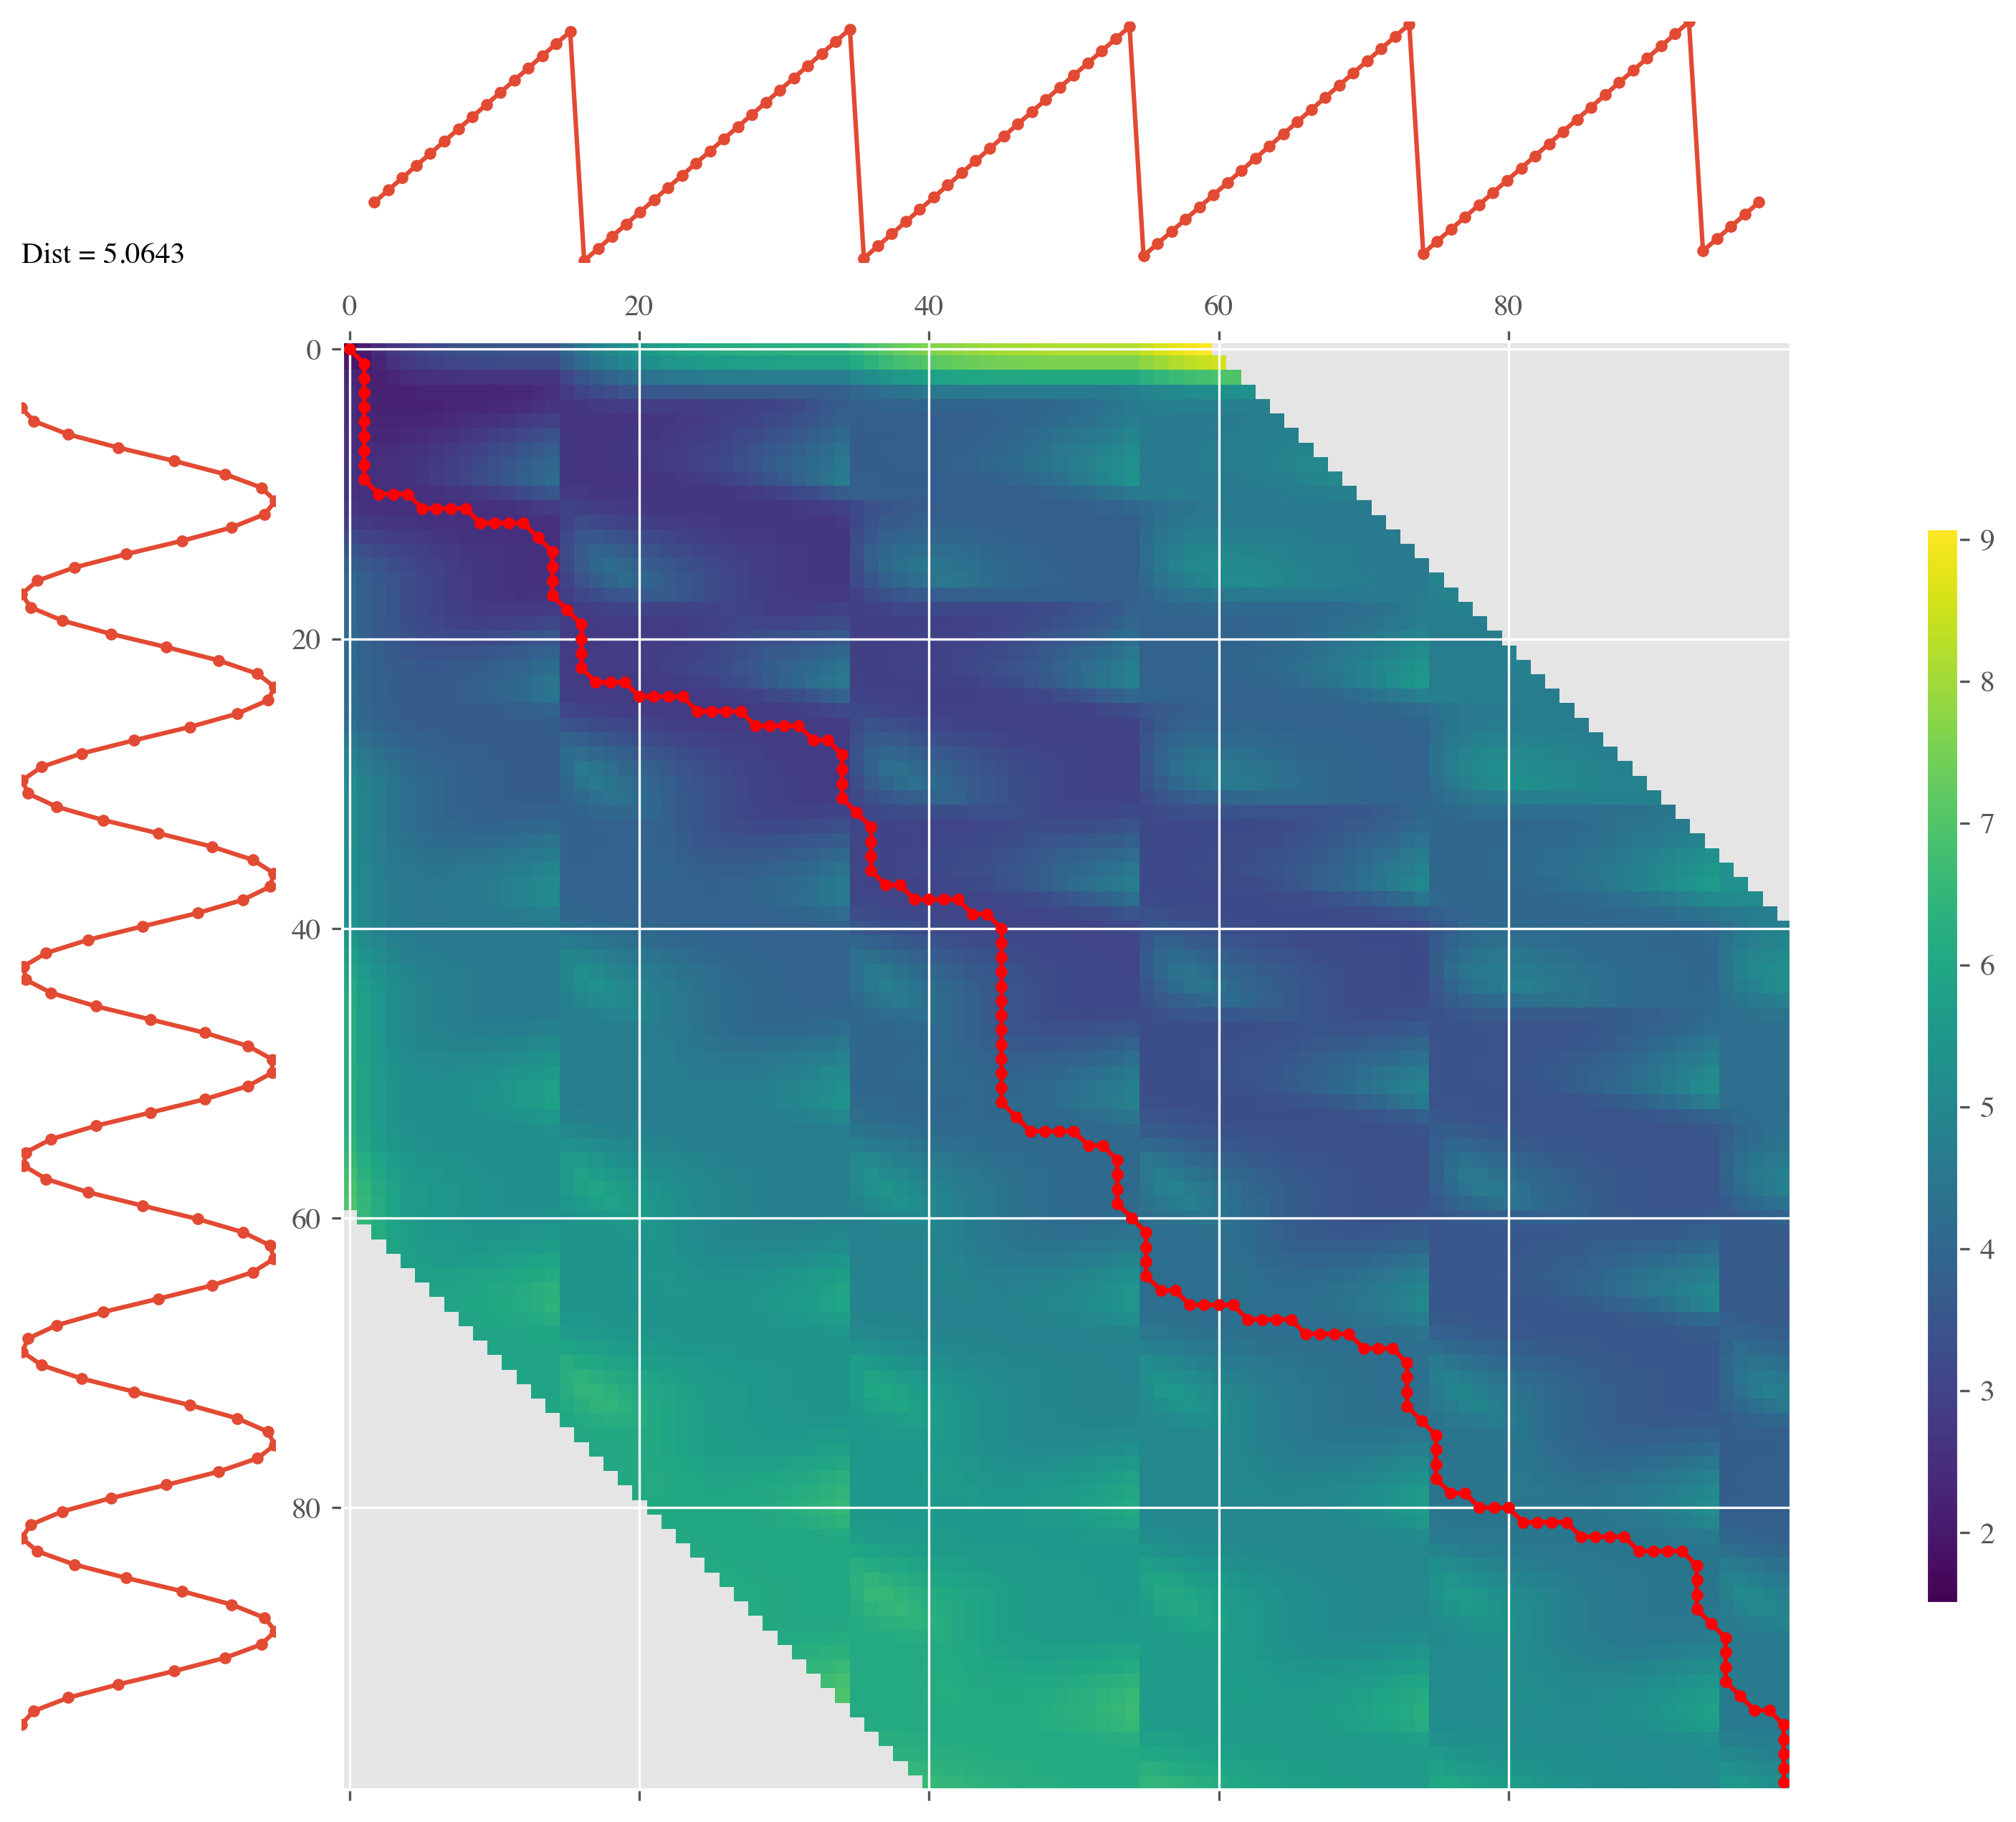
Plot warping path
matplotlib.rcParams['pdf.fonttype'] = 42
distance,_,_ = dtwsig.plot_warping_path()
print(f"DTW distance between signals: {distance:.4f}")

plt.savefig("warping_path_s1_s2.pdf", bbox_inches='tight')
DTW distance between signals: 5.2093
dtwsig.plot_matrix(windowfrac=0.6, psi=None) #Only allow for shifts up to 60% of the minimum signal length away from the two diagonals.
plt.show()
Create multiple signals
fs = 100   # sampling rate, in Hz
T  = 1      # duration, in seconds

N  = T * fs # duration, in samples
M  = 5      # number of sources
S1 = np.sin(2 * np.pi * t * 7)
S2 = signal.sawtooth(2 * np.pi * t * 5)
S3 = np.abs(np.cos(2 * np.pi * t * 3)) - 0.5
S4 = np.sign(np.sin(2 * np.pi * t * 8))
S5 = np.random.randn(N)

time_series = np.array([S1, S2, S3, S4, S5])

## instantiate the class
dtw_cluster = dtw_clustering(time_series,labels=['S1','S2','S3','S4','S5'])

matplotlib.rcParams['pdf.fonttype'] = 42
dtw_cluster.plot_signals()
# plt.show()
plt.savefig("base_functions.pdf", bbox_inches='tight')
Compute the relative DTW distance between the signals
ds = dtw_cluster.compute_distance_matrix(compact=False)
array([[0.        , 5.15998322, 4.19080907, 5.77875263, 7.95685039],
[5.15998322, 0.        , 4.74413601, 7.71110741, 9.31343712],
[4.19080907, 4.74413601, 0.        , 8.75201301, 8.51048008],
[5.77875263, 7.71110741, 8.75201301, 0.        , 9.18406086],
[7.95685039, 9.31343712, 8.51048008, 9.18406086, 0.        ]])